

A retailer may have a well-stocked section that customers rarely reach. Products are available and displays are in place, yet visitor movement repeatedly drops before shoppers enter that part of the store. The problem may come from visibility, aisle design, fixture placement, or natural walking routes. In-store analytics can help retailers identify these patterns through customer traffic, dwell time, and heatmap data.
Finding a dead zone is therefore not simply a matter of locating the quietest corner. Retailers need to compare customer routes, engagement, sales, and the intended purpose of each area. OVOPARK provides AI-powered analytics for customer traffic, dwell time, heatmap, and demographic analysis, which can contribute data to this process, while the final judgment still depends on the store context.
What Is a Dead Zone in a Retail Store?
A dead zone is an area that receives less customer traffic or engagement than nearby parts of the store. It may appear in a back aisle, behind a large fixture, beside a poorly positioned display, or in a section that customers do not naturally reach.
Low traffic alone does not prove that the space has a problem. Some categories attract fewer shoppers because they serve specific needs. A retailer should first consider what the area is designed to do and how much traffic would normally be expected.
Time also matters. A section that is quiet on one afternoon should not immediately be classified as a dead zone. Traffic should be reviewed across comparable days and trading periods to find recurring patterns.
Where Do Customer Routes Begin to Break Down?
Customer routes provide useful clues about how a dead zone develops. Retailers can examine common paths from entrances toward product areas, service counters, fitting rooms, checkout zones, and other destinations.
If visitor movement repeatedly falls after a particular aisle or fixture, the surrounding layout deserves attention. The route may be difficult to see, or another display may encourage shoppers to turn in a different direction.
Dwell time adds another perspective. Customers who enter an area and leave within seconds behave differently from those who stop to examine products. Comparing traffic and dwell patterns helps retailers distinguish a low-traffic area from a low-engagement area.
Traffic and Sales Tell Different Parts of the Story
Sales records should be reviewed alongside customer movement. A section with relatively low traffic may still generate healthy sales if visitors arrive with clear purchase intentions. Increasing traffic may not be the main priority in that case.
The opposite situation also occurs. A display may sit on a busy customer route but generate limited sales. Product selection, pricing, presentation, or customer interest may require closer review rather than the physical location itself.
This is where store operations analytics can provide useful context. Retailers can compare visitor flow with transactions, product categories, promotional periods, and operating conditions. These comparisons help teams understand whether the issue comes from limited exposure or what happens after customers reach the area.
Visibility and Access Can Shape Customer Movement
Store layouts that look balanced on a floor plan may work differently once fixtures and displays are installed. Tall shelving can reduce visibility. Narrow entrances to an aisle may discourage movement. Signage can also direct attention toward one section while leaving another less noticeable.
Managers can examine the store from the customer’s viewing angle. An important question is whether shoppers can see the next section before they reach it. A destination that is hidden from the main route may receive less spontaneous traffic.
Small physical changes can provide useful tests. Moving a sign, lowering a display, widening a route, or changing fixture orientation may affect how customers enter the area. Traffic data collected afterward can show whether movement actually changed.
Why Customer Profiles Add Useful Context
Stores with similar layouts do not always produce similar movement patterns. Their customer groups may differ in age, gender, shopping purpose, and product preferences. These differences can influence which areas receive attention.
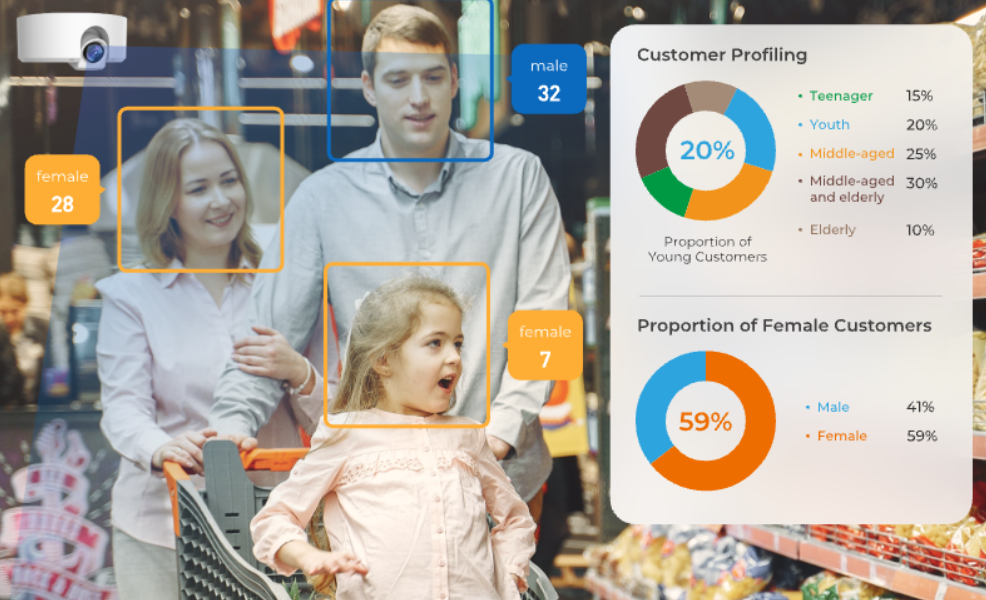
Customer demographic analysis can add context to this analysis. OVOPARK offers demographic analysis that provides information on age groups and gender, helping businesses understand visitor characteristics alongside other store data. This information can be reviewed together with observed customer behavior rather than used on its own.
When customer profiles are combined with in-store analytics, a quiet section can be examined in greater detail. It may attract fewer visitors overall but show stronger relevance to a particular customer group. This distinction can affect decisions about merchandising and product placement.
Test Layout Changes With Comparable Data
Once a possible dead zone has been identified, changing several elements at once can make the result difficult to interpret. A more practical approach is to test one adjustment and measure what happens afterward.
For example, a retailer might reposition one promotional display while leaving the surrounding layout unchanged. Traffic and dwell time can then be compared with a similar period before the adjustment.
External conditions should also be considered. Holidays, weather, promotions, local events, and changes in opening hours can affect store traffic. Comparing similar trading periods reduces the risk of attributing a temporary traffic change to the layout.
What Should Retailers Do With a Dead Zone?
A quiet area does not always need more traffic. Retailers should first decide what that space is expected to do. Some sections need stronger product exposure, while others serve a specific category or a smaller customer group. Store operations analytics can provide evidence for that judgment by connecting movement patterns with sales and customer behavior.
If a zone is genuinely underused, the next step can be a controlled layout test rather than an immediate redesign. Changing a fixture, sign, display, or access route and then measuring the result gives retailers something concrete to compare. Over time, this approach turns dead-zone analysis into a practical way to understand how store design affects real customer movement.
